This is an old revision of the document!
Table of Contents
Process a sample set
To process a sample set and perform dose estimation, select it in the left tree and click the ‘Process sample set’ menu item under the ‘Run’ menu. The sample set can either belong to a scenario or be isolated.
Prepare
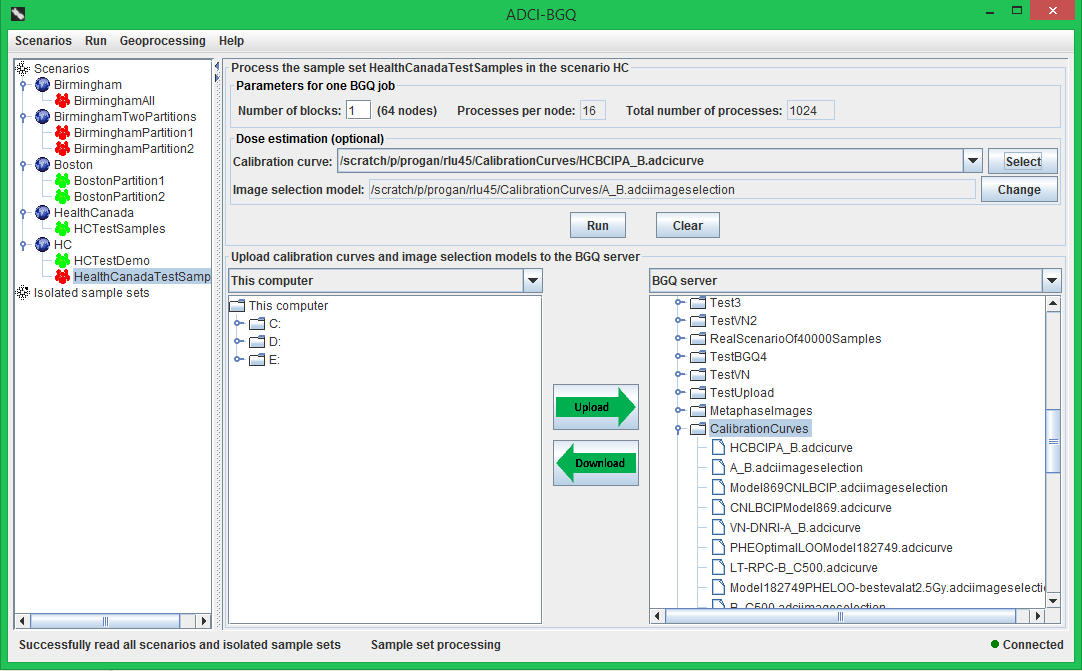
First, you need to upload the calibration curves and image selection models that will be used for dose estimation on the sample set from your local computer to the server, which can be accomplished by the bottom area of the right panel. In the bottom area, the left tree shows the contents on the computer you are using; the right tree shows the contents in your BGQ account. In the left tree, locate and select the calibration curves and image selection models; in the right tree, select a destination directory to which the files will be uploaded, then click the middle 'Upload' button. The recommended destination directory 'CalibrationCurves' is selected and expanded by default.
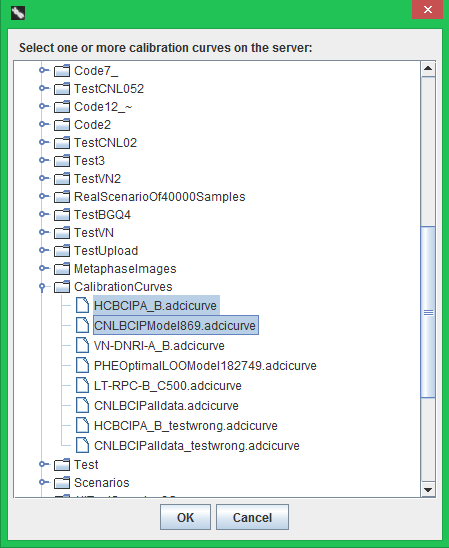
Then you need to set the value of the parameter ‘Number of blocks’, which is required by submission of one BGQ job. The recommended value is the prepopulated '1'. Optionally, you can also choose to simultaneously estimate radiation doses that the samples were exposed to while processing the sample set, by selecting one or more calibration curves on the BGQ server using the ‘Select’ button. After clicking the ‘Select’ button, the popped-up remote file chooser will only show the curve files on the server, and the recommended 'CalibrationCurves' will also be automatically selected and expanded.
Upon selection of a curve, the image selection model associated with the curve will be automatically displayed in the ‘Image selection model’ text field. You can also use the ‘Change’ button to change the model that is associated with the curve. Use the bottom area of the right panel to first upload the curves and models.
Monitor progress
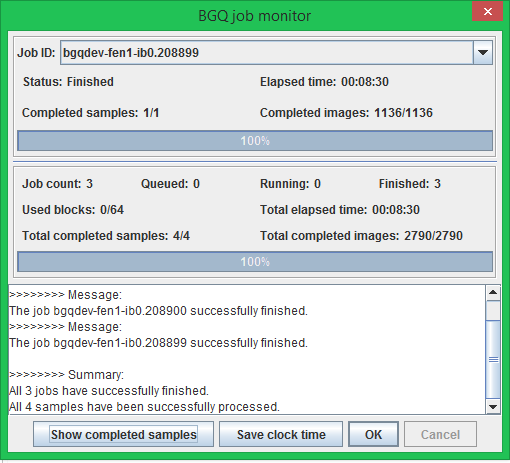
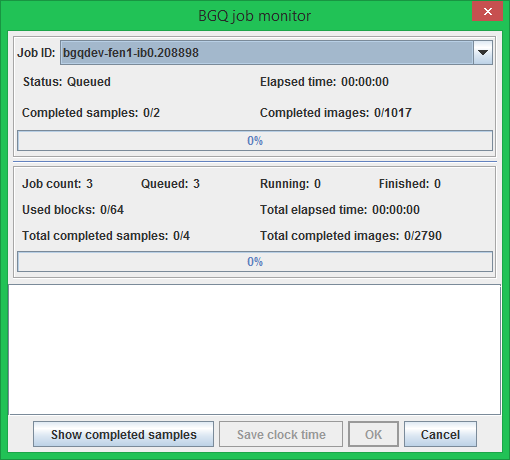
After setting these information, click the ‘Run’ button to submit jobs and start the processing of the sample set. A progress dialog will appear.
In this dialog, the top grouping box displays the detailed progress information for the particular job currently being selected in the drop-down list, with the progress bar graphically showing the percentage progress of this job.
- ‘Status’ label: the current status of the job, among three possible statuses (Queued, Running, Finished).
- ‘Elapsed time’ label: how long the job has been running for.
- ‘Completed samples’ label: the number of completed samples in this job to date/the total number of samples in this job.
- ‘Completed images’ label: the number of completed metaphase images in this job to date/the total number of images in this job (i.e. the sum of image counts in all samples in this job).
The middle grouping box displays the overall progress information for all jobs, with the progress bar graphically showing the percentage progress of all jobs.
- ‘Job count, Queued, Running, Finished’ labels: the total number of jobs submitted and the number of jobs in each status.
- ‘Used blocks’ label: the number of blocks in the BGQ supercomputer currently being used by ADCI-BGQ.
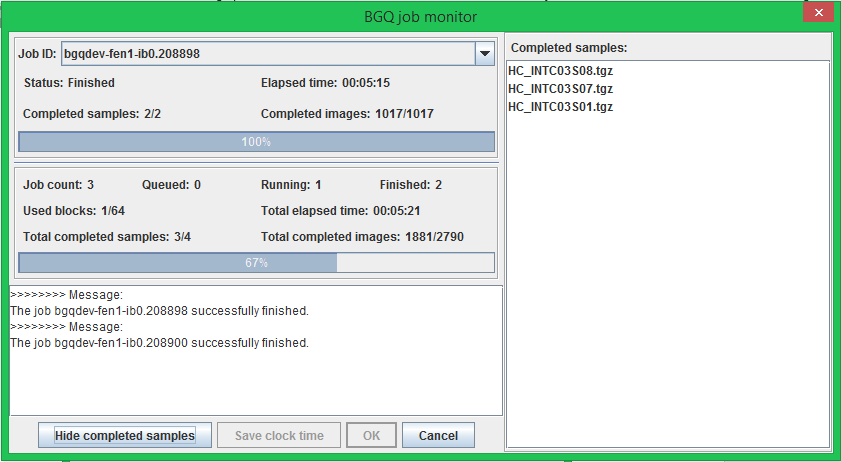
- ‘Total elapsed time’ label: how long all jobs have been running for since the first one started running.
- ‘Total completed samples’ label: the number of completed samples in all jobs to date / the number of samples in this sample set.
- ‘Total completed images’ label: the number of completed samples in all jobs to date / the number of images in this sample set.
The text area displays a feedback message when each job terminates and a summary message after all jobs terminate. At the bottom of this dialog, four buttons provide the following functionalities:
- ‘Show/Hide completed samples’ button: shows or hides the panel to the right that lists the names of all completed samples to date.
- ‘Save clock time’ button: becomes clickable after all jobs terminate. Click it to save the clock time of all jobs running to a .csv file.
- ‘Cancel’ button: Click it to cancel all jobs. Results of completed samples will remain, running jobs will be killed and queued jobs will not get run.