This is an old revision of the document!
Table of Contents
Optimal image selection search report
After finishing an optimal image selection model search (same as image selection model optimization), users can summarize the search by generating an optimal image selection search report. The report records the search configuration such as evaluation method and optimal image selection model result. Users can specify which optimal models found in the search to be included in the report.
Content
An optimal image selection search report contains the following content:
- Model Generation Method, which include number and type information of generated models.
- Model Evaluation Method.
- Evaluation Sample Configuration, including sigma value, physical doses etc.
- Optimal Model Found in Search. This is a table of models specified by users when generating the report. The table shows all parameters in all listed model, as well as their ranks in the search and their evaluation scores.
- Figure Demonstration of Evaluation. The report includes a figure for each listed model to demonstrated the evaluation result when it is applied to a user-specified sample.
Creation
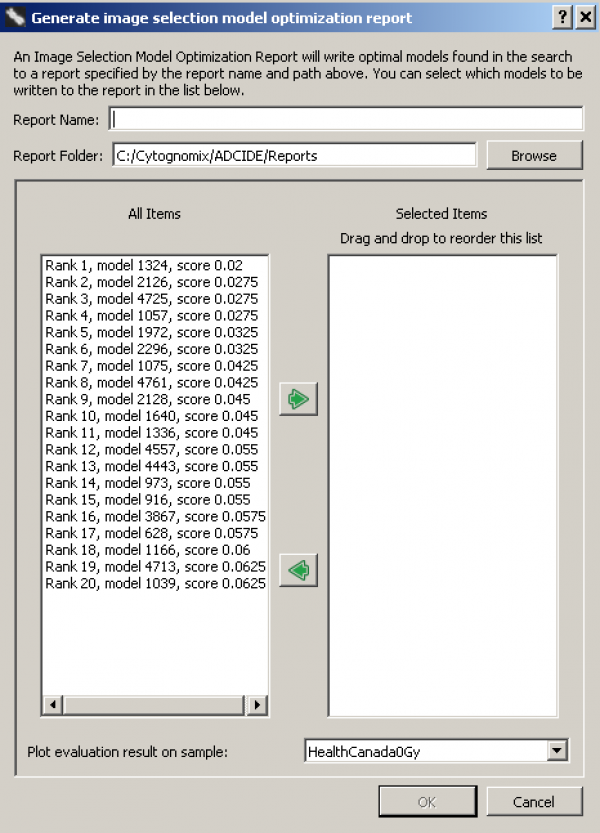
When an optimal image selection model search finishes, the top 10 optimal models will be presented by default. Before generating a report, users could load more optimal models by clicking the 'More' button until the models of interest appear in the list. Click the 'Report' button. A dialog similar to other report generations will pop up.
- Specify a name for the report
A name for this report. A report directory containing images and an report.html file will be created automatically using this name. - Specify models to be added to the report
The list on the left side, 'All Items' list, shows all optimal models that are present in the search dialog. If more models are desired, they should be added before clicking 'Report' button.
Models in the list on the right side, 'Selected Items' list, will be written into the report in the same order as they are in the list. Users can add highlighted models from 'All Items' to 'Selected Items' using the arrow button which is pointing to the right. Similarly, models in 'Selected Items' can be removed by the arrow button of the opposite direction. The order of models can be adjusted by dragging and dropping. - Specify which sample to plot in the report for figure demonstration of evaluation result
A tested image selection model in the search calculates a score for each evaluation sample, after the model is applied to the sample. Users can view a plot demonstration of the evaluation for a specified model and a specified sample in the search dialog.
These plots will be also added to the report. Users specify an evaluation sample in the 'Plot evaluation result on sample' drop-down button. The report will include a plot demonstration for each model in the 'Selected Items' list showing the result when it is applied on the specified sample.