Perform Kriging on a scenario
Given the values of a number of discrete, individual locations, the Kriging algorithm interpolates the value of each location in a region containing these input locations. Due to resource constraints (e.g. number of responders), it is not realistic to collect a sample from every person who was potentially radiated and needs treatment in the region where the nuclear scenario occurred. Therefore, the Kriging result of a scenario illustrates a fast estimation on the impact of the nuclear event, computationally inferred from the small number of samples.
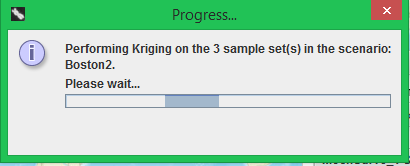
To perform Kriging on a scenario, after displaying its sample locations on a map (see the previous section), first select the dose version (i.e. the combination of a curve and an image selection model) you want to use for each sample set in the 'Sample locations' pane, then click the ‘Perform Kriging’ menu item under the ‘Geoprocessing’ menu. If it is the first time to perform Kriging on this dose version of this scenario (i.e. this combination of dose versions of the contained sample sets), a progress dialog will appear.
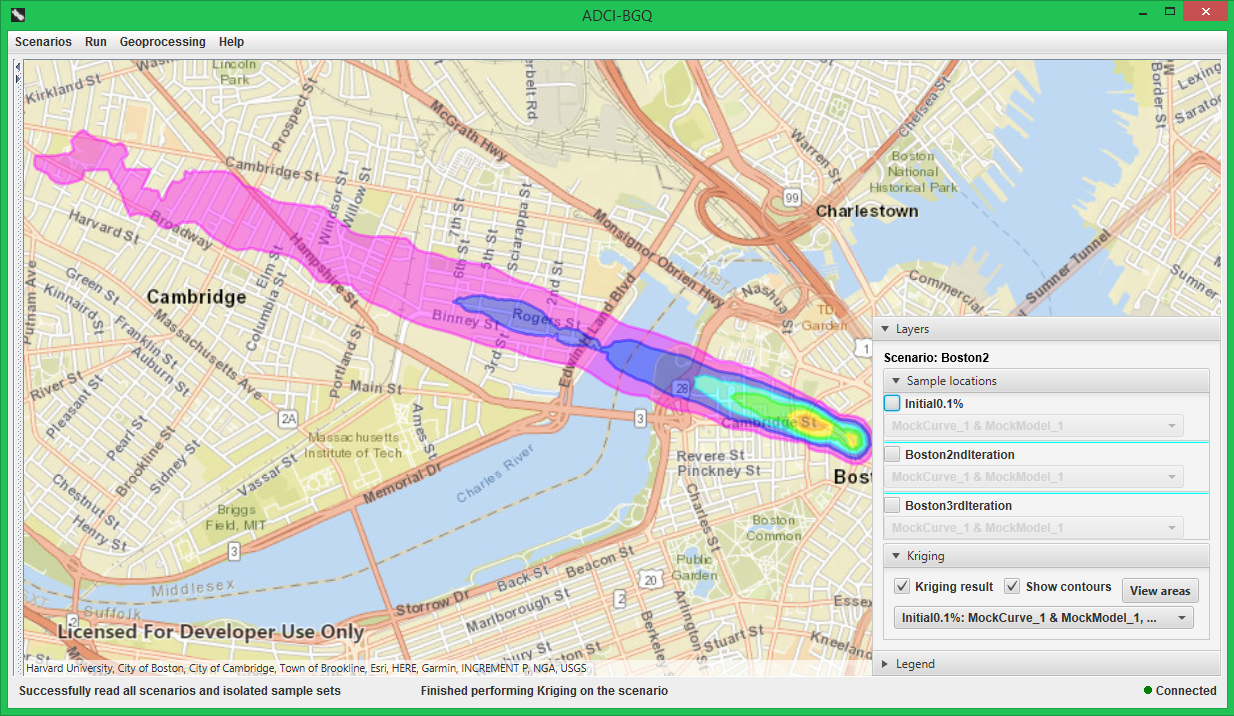
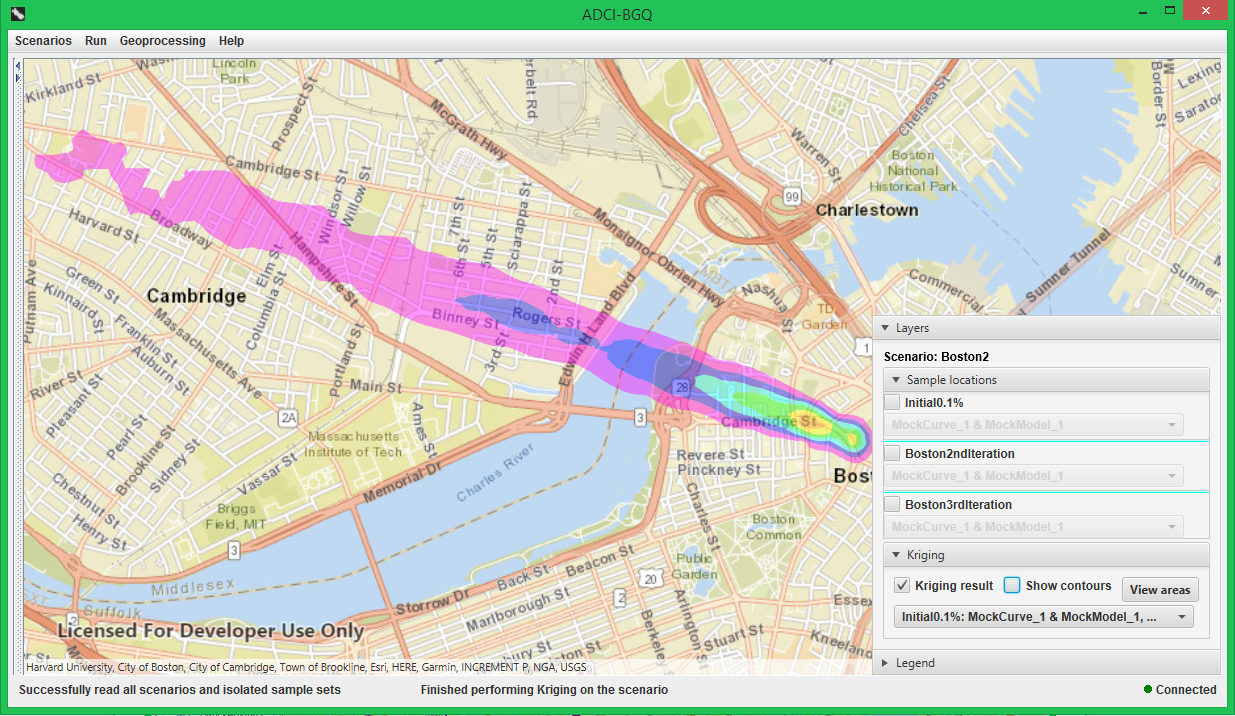
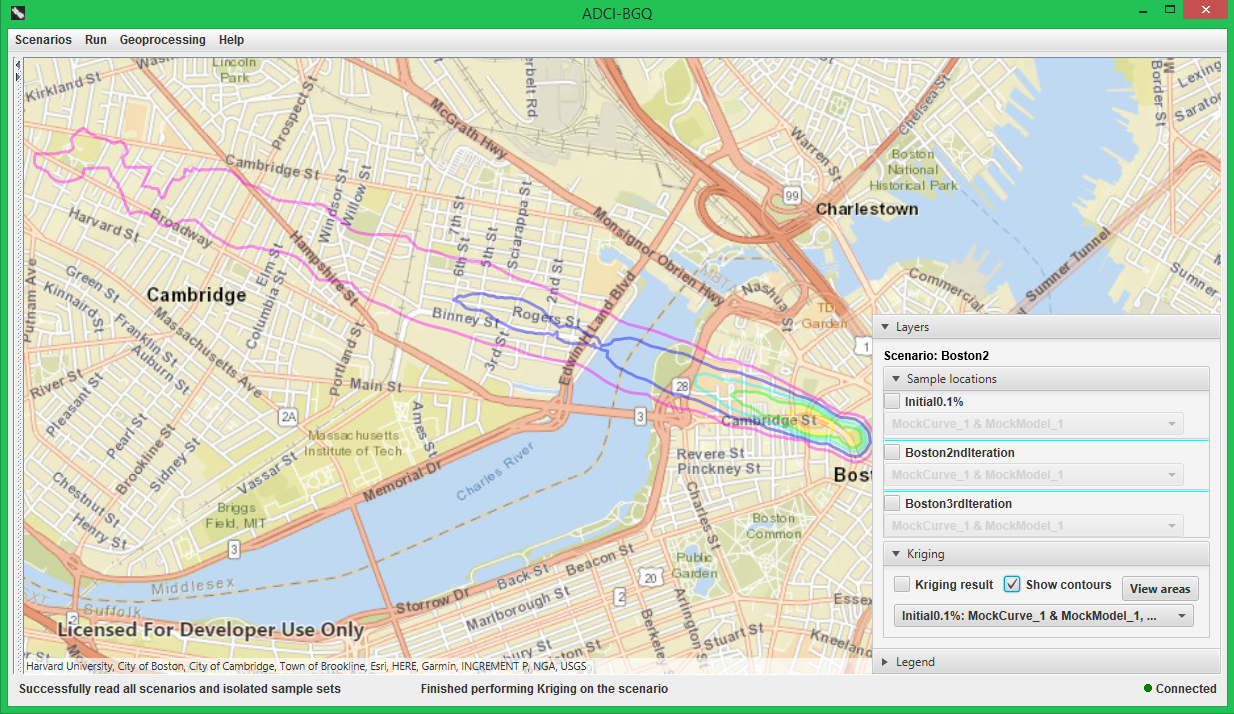
The following figure shows that the Kriging result will be displayed on the map using the colors (i.e. dose ranges) in the legend, and a Kriging pane will appear in the botton-right control. Checking the 'Kriging result' checkbox will display the filled regions with different dose ranges on the map; checking the 'show contours' checkbox will display the contours of these regions on the map. Thus using these two checkboxes, you can achieve four different views of the Kriging layer, i.e. displaying both the filled regions and contours (the default), either one of them, or neither (see the following three figures).
Since a sample set can have multiple dose versions under different curves/image selection models, a scenario can have multiple Kriging results between which the dose version of at least one sample set differs. The drop-down list in the Kriging pane contains all Kriging results that have been produced for the scenario. Selecting another item in this drop-down list will result in the display of the corresponding Kriging result on the map.
View areas of different regions in a Kriding result
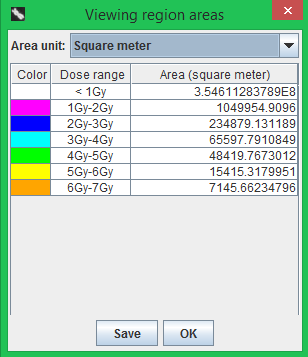
To view the areas of the regions with different dose ranges in the Kriging result currently being displayed on the map, click the 'View areas' button in the 'Kriging' pane. In the popped-up dialog, you can choose the unit with which the region areas will be measured using the drop-down list at the top, including square meters, square kilometers, square miles, acres and hectares. Each row of the table shows the area of one region with a particular dose range in the Kriging result, under the selected unit. You can also save this area table to a local file by clicking the 'Save' button and selecting a destination directory.