
main:dosereport
This is an old revision of the document!
Table of Contents
Dose estimation report
A dose estimation report is a report containing information related to a previously performed dose estimation.
Content
A dose estimation report contains the following content:
- Description of calibration curves present in dose estimation
- Dose estimation plot. A plot legend is located below the plot containing both curves and DC frequencies.
- Tabular dose estimation results
Creation
Dose estimation steps must be performed before generation of this report. Dose estimation reports are generated based on the contents of the plot. Thus, a plot generated when dose estimation is performed must be present in the plot area at the time a report is generated.
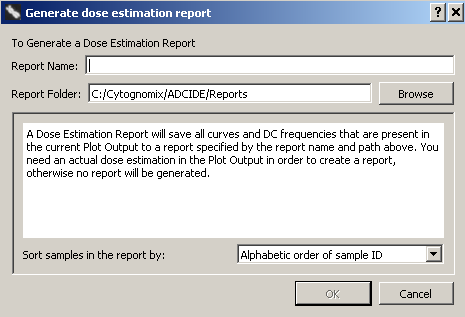
After dose estimation has been performed, to open the dose estimation report generation dialog click “Report” in the menu bar at the top of the software window and select “Dose estimation report”.
- Specify a name for the report
A name for this report. A report directory containing images and an report.html file will be created automatically using this name. - Select curves
Include curves in the report by placing a checkmark beside appropriate curves in the “Select curves to be included in the report” list. Selection of one or more curves is required. - Click “OK” to begin report generation
The report will open automatically in several seconds. It is also automatically saved as an HTML file located in the “Report Folder”/“Report Name” directory specified during report generation. Open the file “Report.html” to view the report. For more information about the location of saved reports consult the reports page.
main/dosereport.1488827233.txt.gz · Last modified: 2017/03/06 19:07 by 127.0.0.1