
Table of Contents
Image selection model
An image selection model is a series of filters which exclude undesirable images within a sample from use in calibration curve generation or dose estimation. Excluded images are still present in the sample and can be viewed in the metaphase image viewer within which they can be manually re-included.
Apply an image selection model
Image selection models can be applied to a sample in three ways:
- Calibration curve wizard
In the calibration curve wizard, an image selection model may be chosen. If a model is chosen, it will be applied to all samples selected in the wizard when “Finish” is pressed. - Dose estimation wizard
In the dose estimation wizard, an image selection model may be chosen. If a model is chosen, it will be applied to all appropriate samples selected in the wizard when “Finish” is pressed.
Note when an image selection model is applied within either wizard, all images in each selected sample will first be included (meaning there will be no excluded images from previously applied models) before the chosen model is applied.
- Within the metaphase image viewer
Image selection models can be applied within the metaphaseimgviewer. Consult the metaphase image viewer page for more details on how to apply existing image models or create your own there. Please note, the above notice regarding wizards and how they apply image selection models applied for all previously applied image selection models.
Image selection models always only exclude images. They do not re-include images excluded by a previously applied image selection model or by manual exclusion except when automatically applied by a wizard (as described above). If this is not the desired behaviour and you would like to apply the image selection model to a “clean” sample with no images excluded, click the “Include All” button before loading the new image selection model.
Contents of an image selection model
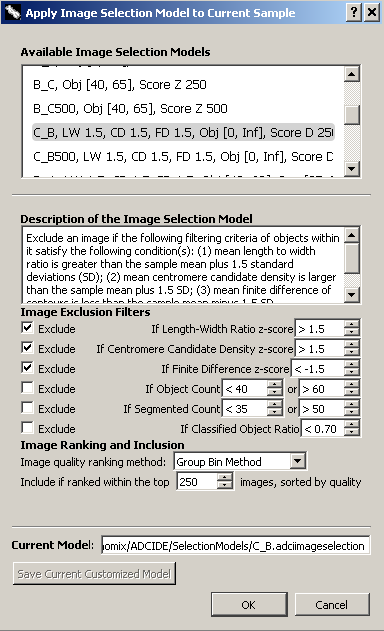
The dialog found to the right can be found in the metaphase image viewer. It is used here to show what properties can be modified in an image selection model. When viewing a list of image selection models within wizards and elsewhere, model property values are shown after the model name using an abbreviation for each property. These abbreviations are listed below, within the header for each property. Properties of the model are as follows:
- Description
A description of the image selection model. This description will appear when selecting image selection models in the calibration curve wizard and dose estimation wizard. - LW - Exclude if length-width ratio z-score is > [value]
Length-width ratio is the average length-width ratio of all chromosomes in an image. This filter excludes images with excessively long or thin chromosomes in a sample. - CD - Exclude if centromere candidate density z-score is > [value]
Represents average level of “noise” in chromosome contours. This filter excludes images with severely “noisy” chromosome contours in a sample. - FD - Exclude if finite difference z-score is < [value]
Represents the average concavity level of chromosomes in an image. This filter excludes images with chromosomes showing insufficient centromere constriction in a sample. - Obj - Exclude if object count is < [value] or > [value]
The number of total objects found in an image, excluding noises and nuclei. Ideally, it would be 46. This filter excludes images with too few or too many chromosomes. - Seg - Exclude if segmented count < [value] or > [value]
The number of objects processed by GVF algorithm in an image. Segmented objects (processed by GVF) are subset of total objects. Ideally, it would also be 46. This filter is similar to object count filter, but more stringent. - Ratio - Exclude if classified object ratio < [value]
The ratio of objects recognized as chromosomes and segmented objects. Classified objects (recognized as chromosomes) are subset of segmented objects. This filter excludes images in which chromosomes are not recognized effectively. - Score - Image ranking and inclusion method
We recommend the minimum number of images remaining after image selection to be greater than 200-250 images.1)- None: ADCI uses no image ranking and inclusion.
- Group Bin Method: ADCI uses group bin method to score images and selects a user-specified number of top-ranked images. This method compares chromosome area pattern in an image with standard base-pair pattern. More information about this method can be found on the group bin method page.
- Combined Filter Score Method: ADCI uses combined filters to score images and selects a user-specified number of top-ranked images. This method combines features of filters as a weighted sum. Users specify a method to calculate weights (IQR or MAD) or fill custom weights.
Suggested procedure for creating a new image selection model
1. Load a set of processed calibration and test samples.
2. Create a sample report with all samples
3. To create new Image Exclusion Filter thresholds: Examine distributions to find thresholds (as +S.D. above or below the mean value for the test) that can be applied to the majority of samples that remove a subset of images. This should be based on outlier values that distinguish the majority of images for a test from rarer images. For example, we expect 46 chromosomes in a metaphase cell. Most images will contain <60 objects (chromosomes + nuclei). Images with >60 objects are infrequent and are more likely to indicate excessive sister chromatid separation or multiple metaphase cells, or a lot of debris may be present.
4. To test a threshold for a test, open the metaphase image viewer for each sample, click on “apply image filters”, and check the box corresponding to the threshold you wish to apply, then change the default threshold value(s) to those you determined using the Sample Report. The number of images in the subset will usually be reduced from the complete set of images. Select view excluded images and review these. Verify that you want to remove these images by sorting the list by, for example, object count (top right selection), and carefully reviewing images close to the threshold boundary that you have chosen. You can scroll through the list using the green arrows (bottom left), or jump to particular images (threshold is shown in brackets) using the file name selector. If necessary, adjust the threshold and repeat the filtering and review step until you have selected a threshold. Record this threshold and the associated test.
5. Repeat step 4 for the other tests that you wish to apply to the data. The filtering is cumulative: images that are removed by one test, if selected for removal by another, will not be repeatedly eliminated.
6. After all of the image selection filters have been determined, then decide whether additional thresholds are required based on sorting. The combined Z score or group bin methods can sort images from highest to lowest quality, then the top X images can be selected for dose estimation or calibration curve generation. X should be at least 250, however if a larger number of high quality images pass the preceding tests (steps 4 and 5), then the top scoring image count can be higher (≥ 500).
7. Save the combined image selection model on the “apply image selection model” window by selecting “Save Current User Customized Model” and assigning a name to the model. Hint: assign a model name that describes the filters used in the model for future reference. The model name will appear in you list of models that can be applied to future samples.
8. Note: After Z score based thresholding, it may not be necessary to apply sorting-based thresholding to further select images. Alternatively, the user may opt to only apply sorting-based thresholding to obtain an image set, without using Z score based thresholding
9. Calibration curves generated using samples with the image selection model applied can be examined to determine their “goodness of fit”. Consult the fit statistics described under the heading “Curve fitting statistics” on the calibration curve page for more information.