Table of Contents
Automated Search for Optimal Image Selection Models
This feature is present in ADCI v1.7 or newer
The total number of potential image selection models is unlimited and effective image selection model configurations differ between laboratories due to their laboratory specific sample preparation procedures. To alleviate the need to manually create and test sets of image selection models, ADCI provides automated search functionality to locate optimal models for given samples.
The automated search may take a long time to finish, depending on the search configuration. Please read the 'Searching Time' section before using the automated search function.
Methods
Automated searches of optimal image selection models involves two steps: generation of a pool of possible image selection models and evaluation of each model in the pool.
Generating Models
An image selection model consists of morphological filters and/or image scoring. Each filter can either be enabled at a user specified threshold value or be disabled altogether. Images can be scored using the combined z-score method (contents of an image selection model heading) or group bin method. The combined z-score method requires a weight vector in which weights can be adjusted. The number of selected top images after images are scored and ranked is also adjustable. The automated search for optimal image selection models has the capability to test all of these configurations.
Image selection models are categorized in 3 groups:
- (1) filter-only models
A typical configuration for automated model generation in this group is shown in the table below. A pool of selection models containing all permutations of the filter thresholds listed in the table are generated. Note each filter may also be in a disabled state in addition to the values listed. Square brackets indicate a pair of threshold values in the format: [lower bound, upper bound].
| Filters | Filtering method | Threshold values to test |
|---|---|---|
| Length-Width Ratio | Exclude if length-width ratio z-score is > threshold | 1.0, 1.5, 2.0 |
| Centromere Density | Exclude if centromere density z-score is > threshold | 1.0, 1.5, 2.0 |
| Finite Difference | Exclude if finite difference z-score is < threshold | -1.0, -1.5, -2.0 |
| Object Count | Exclude if count is < lower bound or > upper bound | [40, 60], [40, 65] |
| Segmented Object Count | Exclude if count is < lower bound or > upper bound | [35, 50] |
| Classified Object Ratio | Exclude if the ratio is < threshold | 0.6, 0.7 |
- (2) combined z-score models without filtering
Image selection models in this group use a weight vector to score and rank images, then select a certain number of top images. Typically, values 0, 1, 2, 3, 4, 5 are tested for weights and numbers 250, 300, 400, 500 are tested for selecting top images. - (3) filter and then group bin models
In this group, a model will first apply filtering and then use the group bin method to score and rank images. Configurations in group 1 and group 2 can be used to generate models in this group.
The total number of generated image selection models can be very large. If the configurations shown above are used, 192384 models are generated.
Model Evaluation
Image selection models in the pool can be assessed using a set of samples with known physical doses. An image selection model is applied to all evaluation samples. Sample quality after image selection is evaluated by one of the user-specified methods listed below, which return a score indicating the effectiveness of the model. Three evaluation methods can be selected:
- (a) P-value of Poisson fits
Each evaluation sample calculates a p-value of its Poisson fit, determined by a user-specified SVM sigma. P-values of all samples combine to a single score through the use of Fisher's method. The score will be 'nan', not-a-number, if any evaluation sample gives 'nan' p-value, making the evaluation invalid. When it happens, please try a larger sigma value or use other evaluation methods. - (b) Curve fitting residual
After users specify a SVM sigma, all evaluation samples are used to fit a calibration curve. The squares of samples' fitting residuals on the curve are summed to a single score. - (c) Leave-one-out dose estimation
Users first specify a SVM sigma. One sample in the evaluation set is used as a dose estimation test sample. While the remaining are used for curve calibration from which the dose estimation error is calculated for the test sample. The process is repeated until every evaluation sample has been used as test sample. The dose estimation error of all these tests are squared and summed to form a single score.
Image selection models with the lowest scores are the optimal models in the search.
Walk-through in ADCI
The following section provides a walk-through of the automated search for optimal image selection models.
Configure Image Selection Model Generation
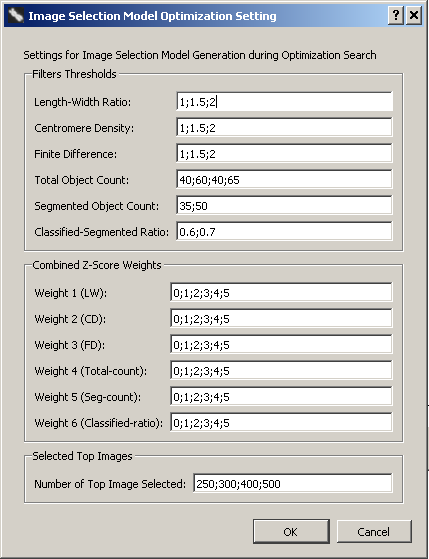
This is an optional configuration step. Default values are prefilled in this dialog whether it is opened or not. To facilitate automated generation of image selection models, the software stores multiple options for filter thresholds, weights of the combined z-score, and number of selected top images. These values can be adjusted by users. To open this dialog click “Settings” in the menu bar at the top of the software window and select “Image Selection Optimization Settings”. The dialog to the right will be displayed and configuration changes can be made within the dialog.

Image Selection Optimization Wizard
Automated searches for optimal image selection model start from “Image Selection Optimization” wizard. It can be opened from the “Wizards” menu. A step by step guide to the wizard is provided below.
Introduction
Before proceeding to the next steps of the wizard, processed samples must be present within the main GUI. The “curve fit residual” evaluation method will require at least 3 samples, the “leave-1-out dose estimation” method at least 4 samples.
Select Samples
Sample selecting in this wizard is the same as in the “Curve Calibration” wizard. Selected samples will be used to evaluate image selection models during optimization. Enter physical doses of these samples if they are not auto-filled or if they were auto-filled incorrectly.
Select an SVM Sigma Value
Select an SVM sigma to use for optimization. It determines dicentric chromosome distributions, which are used to calculate p-values of Poisson fit, and dicentric chromosome frequencies, which are used in the “curve fit residual” method and the “leave-1-out dose estimation” method.
Configure Image Selection Model Search
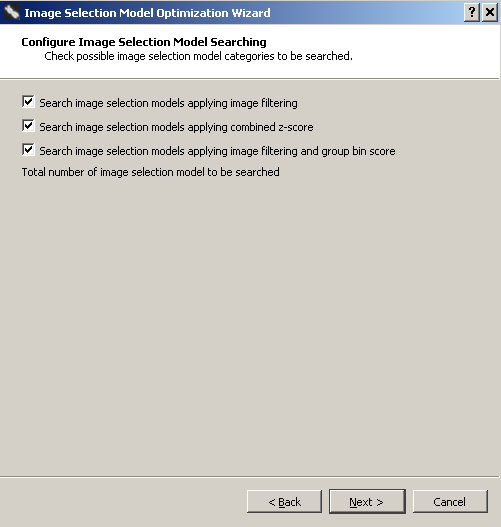
As described in the “Method” section, possible image selection models are logically categorized into 3 groups. In ADCI, users have the option to include or exclude a group in the search of optimal models. Place a checkmark beside groups that are intended to be searched. Leave undesired groups unchecked. Image selection models in checked groups will be generated according to configurations in “Image Selection Optimization Settings”.
Generally, it will be desirable to check all groups to make a full search. However, if computing time is a concern or the search is only for a quick test, users can reduce the number of image selection models to be searched by leaving some groups unchecked.

Select an Evaluation Method
Select one of the three evaluation methods which are explained in the “Method” section. Please be reminded that “Curve Fit Residuals” requires at least 3 selected samples to work correctly, and “Leave-1-out Dose Estimation Errors” needs at least 4 selected samples.

Summary
Ensure your previous selections are correct on this summary screen. Note values entered on previous screens can be edited by clicking the blue button on the top left of the wizard dialog. Click “Finish” to complete the wizard and bring up the “Optimal Image Selection Model Search” dialog.
Optimal Image Selection Model Dialog
The automated search for optimal image selection models is performed in this dialog. A summary, including model generation configuration and evaluation method and samples, is shown in the top part. Users can check if everything is correct.
Click the “Start” button to start the search. The progress will be indicated by a progress bar. The entire search may take a few minutes to a few hours, depending on the number of models being searched, evaluation method (“leave-1-out dose estimation” method will take longer time), and computer hardware. Users can abort the search any time by clicking the “Abort” button.
When the search finishes, optimal image selection models will be displayed in ascending order of evaluation score in the “Search Result” panel. Models are named according to their automatically assigned numbers during model generation. The evaluation score of each model is displayed along with the model in the list. The list shows 10 best models by default. Up to 50 best models can be displayed by clicking the “More” button.
After selecting an image selection model in the list, its content will be shown in the widget to the right of the list. It is the same widget used for image selection models in “Metaphase Viewer”, “Curve Calibration” wizard and “Dose Estimation” wizard. Please note that any modification made to the widget will not change the actual model.
A selected image selection model can be saved by clicking the “Save” button. Its evaluation performance on each sample can be viewed by clicking the “View” button and specifying an evaluation sample. If the evaluation method is “p-values of Poisson fit”, the plot panel will show the sample's Poisson fit. Similarly, the plot panel will show calibration curve and dose estimation for the methods “Curve fit residual” and “Leave-1-out dose estimation errors”, respectively.
After an optimal image selection model has been saved, it will appear alongside other saved image selection models and preset image selection models wherever image selection models are listed. The metaphase image viewer can be used to view the content of a saved selection model.
“Report” functionality will be implemented in future version of ADCI.


Time required to perform a search
Influences on search runtime
The time required to perform a search depends on the number of models being generated/examined. The number of models examined is determined by the selected image selection model categories to search (image filtering, combined z score, group bin) as well as settings specified in “Settings” → “Image Selection Optimization Settings”. If the search space is large, it may take hours to finish the optimization.
Search runtime is proportional to the number of evaluating samples. Evaluation methods also influence the search execution time. The 'p-value of Poisson' and 'curve fit residual' methods take approximately the same amount of time. The 'Leave-one-out' method takes longer, and is proportional to the number of evaluating samples. For example, to finish a search using 10 evaluating samples, 'leave-one-out' will take approximately 10-times longer than either 'curve fit residual' or 'p-value of Poisson'.
Test to estimate required search time
This feature is present in ADCI v1.9 or newer
After evaluating samples and parameters have been selected, click the button “Click to check” adjacent to the label “Time to finish: ”. A quick test will be performed (approximately 10 seconds), after which the estimated time necessary to perform the full search is displayed.
