
Table of Contents
Main GUI
When ADCI software is loaded, the graphical user interface (GUI) shown below is presented. Five major areas of the GUI are denoted by green numbers within circles and are each briefly described in this page. Note each section has a dedicated page, the link to which can be found in each section's brief description.
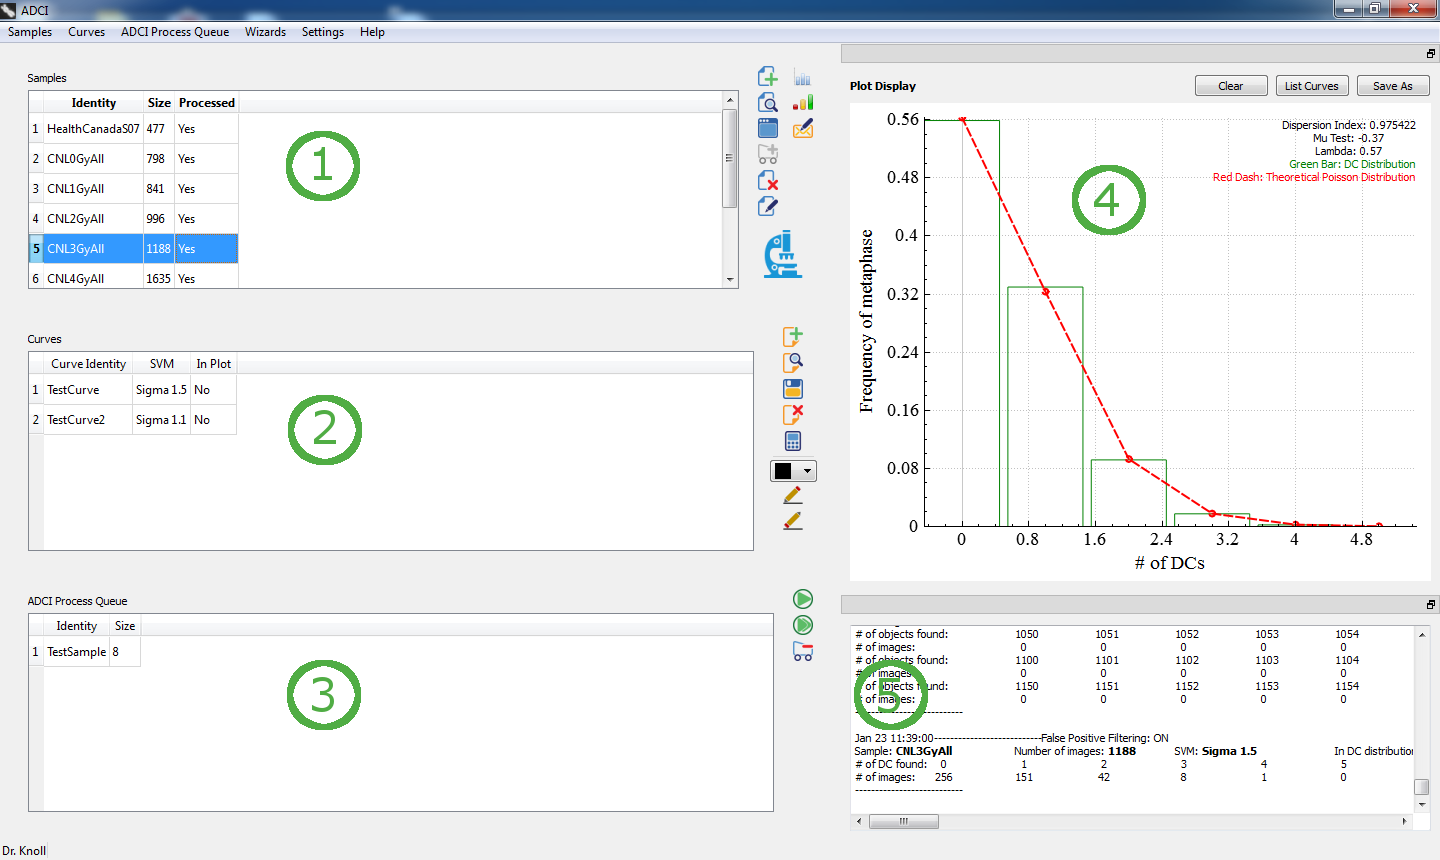
Samples (1)
A list of samples. There are three headers for the list:
- Identity
User defined ID of sample specified at the time of sample creation. - Size
Number of image files found in sample directory - Processed
Possible values: Yes/No. Displays whether the sample has been processed by ADCI software to become a processed sample.
A list of icons is present to the right of the list, each an operation which can be performed on a sample. More information about each operation can be found within the sample page.
Curves (2)
A list of calibration curves. There are three headers for the list:
- Curve Identity
User defined ID of curve specified at the time of curve creation. - SVM
SVM sigma value used to create the curve. - Processed
Possible values: Yes/No. Displays whether the sample has been processed by ADCI software to become a processed sample.
A list of icons is present to the right of the list, each an operation which can be performed on a sample. More information about each operation can be found within the calibration curve page.
ADCI Process Queue (3)
ADCI software processes samples using a queue system within which one sample is processed at a time. For more information on adding samples to this queue, view the sample, processed sample, and ADCI Process queue pages.
Plot Display (4)
Plots are drawn here upon request and in certain cases automatically by the software. A plot currently being displayed can be saved as an image by clicking the “Save As” button. “List Curves” lists all calibration curves present in the plot. “Clear” removes a plot and the plot display area is emptied. See Plots for more information.
Console (5)
Data appears in the console when a sample or a curve is highlighted in the main GUI and when operations have completed such as dose estimation. See console for more information.