This is an old revision of the document!
Table of Contents
Quality control
This functionality will become available in version 1.4 of ADCI. Quality control (QC) metrics are applied to samples and aberrations. QC issues related to samples are visible in the sample list within the main GUI. Samples which do not meet quality control thresholds are marked with a orange or yellow background color in the sample's “Identity” field. Additional quality control issues related to aberrations are colored orange and are visible in the calibration curve and dose estimation dialogs.
Edit thresholds
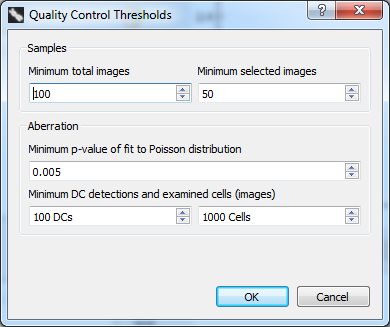
Each threshold observed during quality control procedures can be modified in a dialog accessed by selecting “Settings” in the menu bar, then clicking “Quality Control Thresholds”.
Sample
- Minimum total images
If the total number of images in a sample is less than this value, the software will report a QC issue. - Minimum selected images
If the number of images in a sample after applying an image selection model or through manual exclusion is less than this value, a QC issue will be reported.
Aberration
- Minimum p-value of fit to Poisson distribution
The distribution of dicentric chromosomes in a sample is expected to follow a Poisson distribution. If the p-value of the hypothesis that the distribution fits a Poisson distribution is below this threshold when taking into account any applied image selection models, manually excluded images, and selected SVM Sigma value a QC issue is reported. - Minimum DC detections and examined cells (images)
A QC issue is reported if both the number of DCs found in a sample and the number of examined cells are less than the minimum number of DCs and number of cells examined thresholds specified here. If the observed values of these metrics exceed either quality control threshold, a QC issue will not be reported. The objective of these thresholds is to require either a minimum number of DCs to be observed (most relevant for higher doses), or a minimum number of examined cells (most relevant for lower doses).
How QC issues are reported
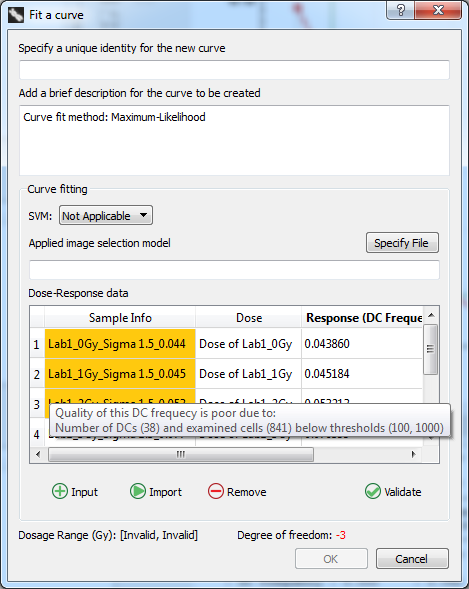
QC issues related to sample image count can be found in the sample list within the main GUI. The “Fit a curve” and “Dose Calculator” dialogs take into account additional “Aberration” QC thresholds. Note manually entering an aberration in either of these dialogs will not generate a QC issue even if the manually entered values do not meet QC thresholds. For a QC issue to be reported, an aberration must be derived from an imported sample.
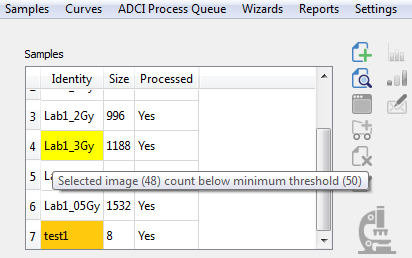
Hover the mouse pointer over the orange or yellow background color of any reported QC issue to display a tooltip reporting which QC threshold was not met. The QC threshold will be displayed alongside the observed value of the sample. If more than one QC threshold was not met, the first failed threshold will appear in the tooltip.
Main GUI
The “Identity” field in the sample list has a background color of orange when a sample does not meet the “Minimum total images” threshold. A background color of yellow is used when a sample does not meet the “Minimum selected images” threshold.
Fit a curve dialog
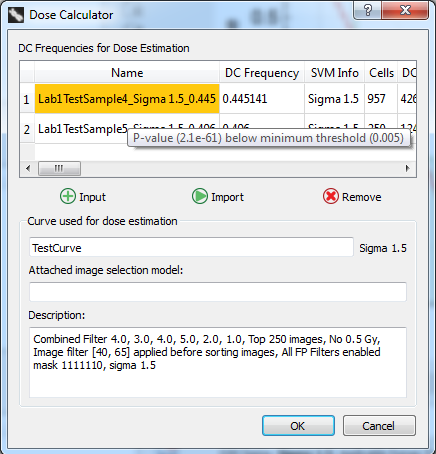
Dose calculator dialog
QC issues in the “Dose calculator” dialog take into account additional “Aberration” QC thresholds. Note a manually entered aberration will not generate a QC issue even if the manually entered value do not meet the specified QC thresholds. For a QC issue to be reported, the aberration must be related to an imported sample.